Pune, Jun 30: A question that might pop up in our everyday conversations is – Are the children really learning what they go to school to learn?
Is there any scientific way to answer that question? Globally, an evaluation called Programme for International Student Assessment (PISA) tries to answer it. India also has its own rating and assessment system. The results of this nation-wide assessment were released earlier this month. We help you understand the results and what they mean for scholastic aptitude of our children.
What is PGI?
Performance Grading Index (PGI) 2019-20 has been released. PGI is a tool to provide insight into the status of school education in all states and union territories, including factors contributing to their performance and primary areas of improvement. India has one of the largest school education systems in the world with more than 15 lakh schools and 25 crore students. Right of Children to Free and Compulsory Education Act and the schemes of Department of School Education and Literacy (DoSEL) have given many children in India access to education. Now that access is available, they are trying to improve the quality of education through PGI.
Why measure School Education Status?
DoSEL has produced this index to measure school education status. The goal is that with continuous grading and focus on improving the quality of education through PGI, all states and UTs will together get the highest grade I and India will be a fully developed nation in education. The aim is not to rank the states but is to find the weak points and strengths of each state, union territory and find out where there is scope to improve. It is supposed to be a useful source of information for the best practices followed by the States and UTs, which can be shared.

Measuring PGI: PGI has 70 indicators under 5 headings. There is a total weightage of 1000 with each indicator having either 10 or 20 points. Some indicators have sub-indicators. The performance of the states and UTs has been checked against specified standards for each indicator.
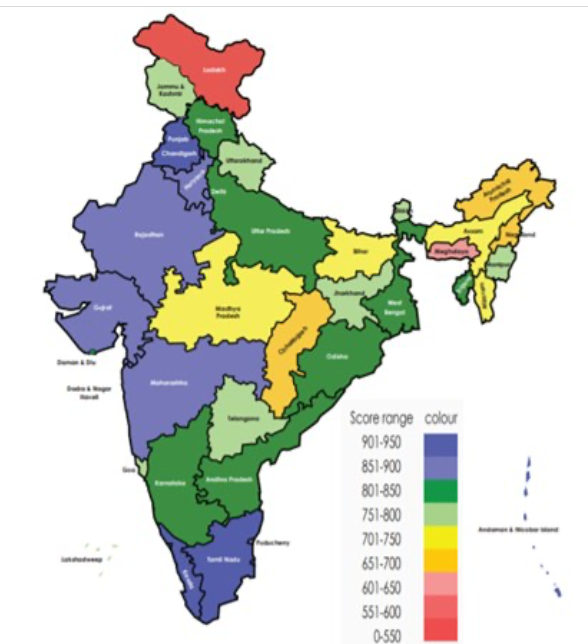
Reasonable and attainable indicator standards have been set. The various grades are Level I (951- 1000), II (901-950), III (851- 900), Level IV (801-850), and so on up to Level IX (551-600), X (0-550). The 5 heads under which the performance is graded are given below.
The 5 heads under which the performance is graded are:
| Domain | Weightage Total 1000 | Examples of Indicators |
| Learning Outcomes, Quality | 180 | Average mathematics, language score in classes 3, 5, and 8. Average science and social studies scores in class 8. |
| Access | 80 | Net Enrolment Ratio, Retention Rate and Transition Rate. |
| Infrastructure & Facilities | 150 | Schools having Science lab, Computer lab, library, graded supplementary material, mid-day meal, free uniform, and free textbooks. |
| Equity | 230 | The difference in performance between Scheduled Caste and General, Scheduled Tribes and General, Urban and Rural, and Boys and Girls. Transition rates. Availability of ramp, toilet, etc. |
| Governance Processes | 360 | Attendance of students and teachers recorded electronically in government database. Availability of teachers, principals, and funds as per norms. Teachers and principals completed leadership training. Transparent transfer and merit-based recruitment of teachers based on qualifications. Spend by State/UT on education out of the total state budget. |
Important Results
- Five States and UTs, namely Andaman and Nicobar Islands, Chandigarh, Kerala, Punjab, and Tamil Nadu have attained the best overall grade (Level II).
2. Ladakh is in Grade VII and Meghalaya is in Grade V.
3. Punjab has the best overall score of 929.
4. A total of 33 States and UTs have improved their total PGI score in 2019-20 compared to 2018-19.
5. All states except Madhya Pradesh and Chhattisgarh have shown an improvement compared to the year 2018-19.
6. Three states, Andaman and Nicobar Islands (Grade I++), Punjab (Grade I++), and Arunachal Pradesh (Grade IV) improved their score by more than 20%.
7. The highest score in Learning Outcomes & Quality was 168/180 (Rajasthan), in Access the highest was 79/80 (Punjab and Kerala), in Infrastructure and Facilities it was 150/150 (Punjab), Equity was 228/230 (Punjab), and Governance Processes was 346/360 (Punjab).
8. This year, for the first-time states crossed the milestone of 901-950 points. In 2017-18, the top grade was Level VI and in 2018-19 it was Level III.
9.19 states have shown improvement in Infrastructure and Facilities and in Equity. 3 states improved in Access and 27 improved in Governance Processes.

2019-20
Credits: https://pgi.udiseplus.gov.in/PGI-State-2019-20-

Credits: https://pgi.udiseplus.gov.in/PGI-State-2019-20-Brochure.pdf
Conclusion and link to PISA
India is moving from rote-learning-based system to a competency-based one. (competency: skill)
In the Programme for International Student Assessment (PISA) conducted by the Organisation for Economic Co-operation and Development, China is the top ranked country. PISA tests students worldwide using an online test.
PISA was last held in 2018. It is held every three years.
When India last took part in 2009, it was ranked second last among 73 countries. India is now going to take part in PISA 2021 and hopes to better its score through initiatives like PGI.